Gene Sets Enrichment Analysis
TAPIR includes a number of functions for gene sets enrichment analysis,
powered by gseapy. Standard GSEA (gsea), preranked
(prerank) and single sample (ssgsea)
analyses can both be run with run_gsea, by selecting
the type.
from tapir.gsets import run_gsea

gsmat = run_gsea(data, subsel=None, type='ssgsea', tmp_path=r'./tmp_gsea')
data needs to contain the expression counts, with samples as rows
and genes as columns, subsel allows to subselect which gene sets
should be included in the analysis. This can help to improve considerably
the computation times. subsel can be a single string or a list
of strings; gene sets whose name contains any of the strings provided
will be included (e.g. HALLMARK_ will include all hallmark of cancer genes).
An exaustive list of gene sets is provided, but a custom file
can be set with ref.
Further flags for gseapy can be provided as keyword arguments.
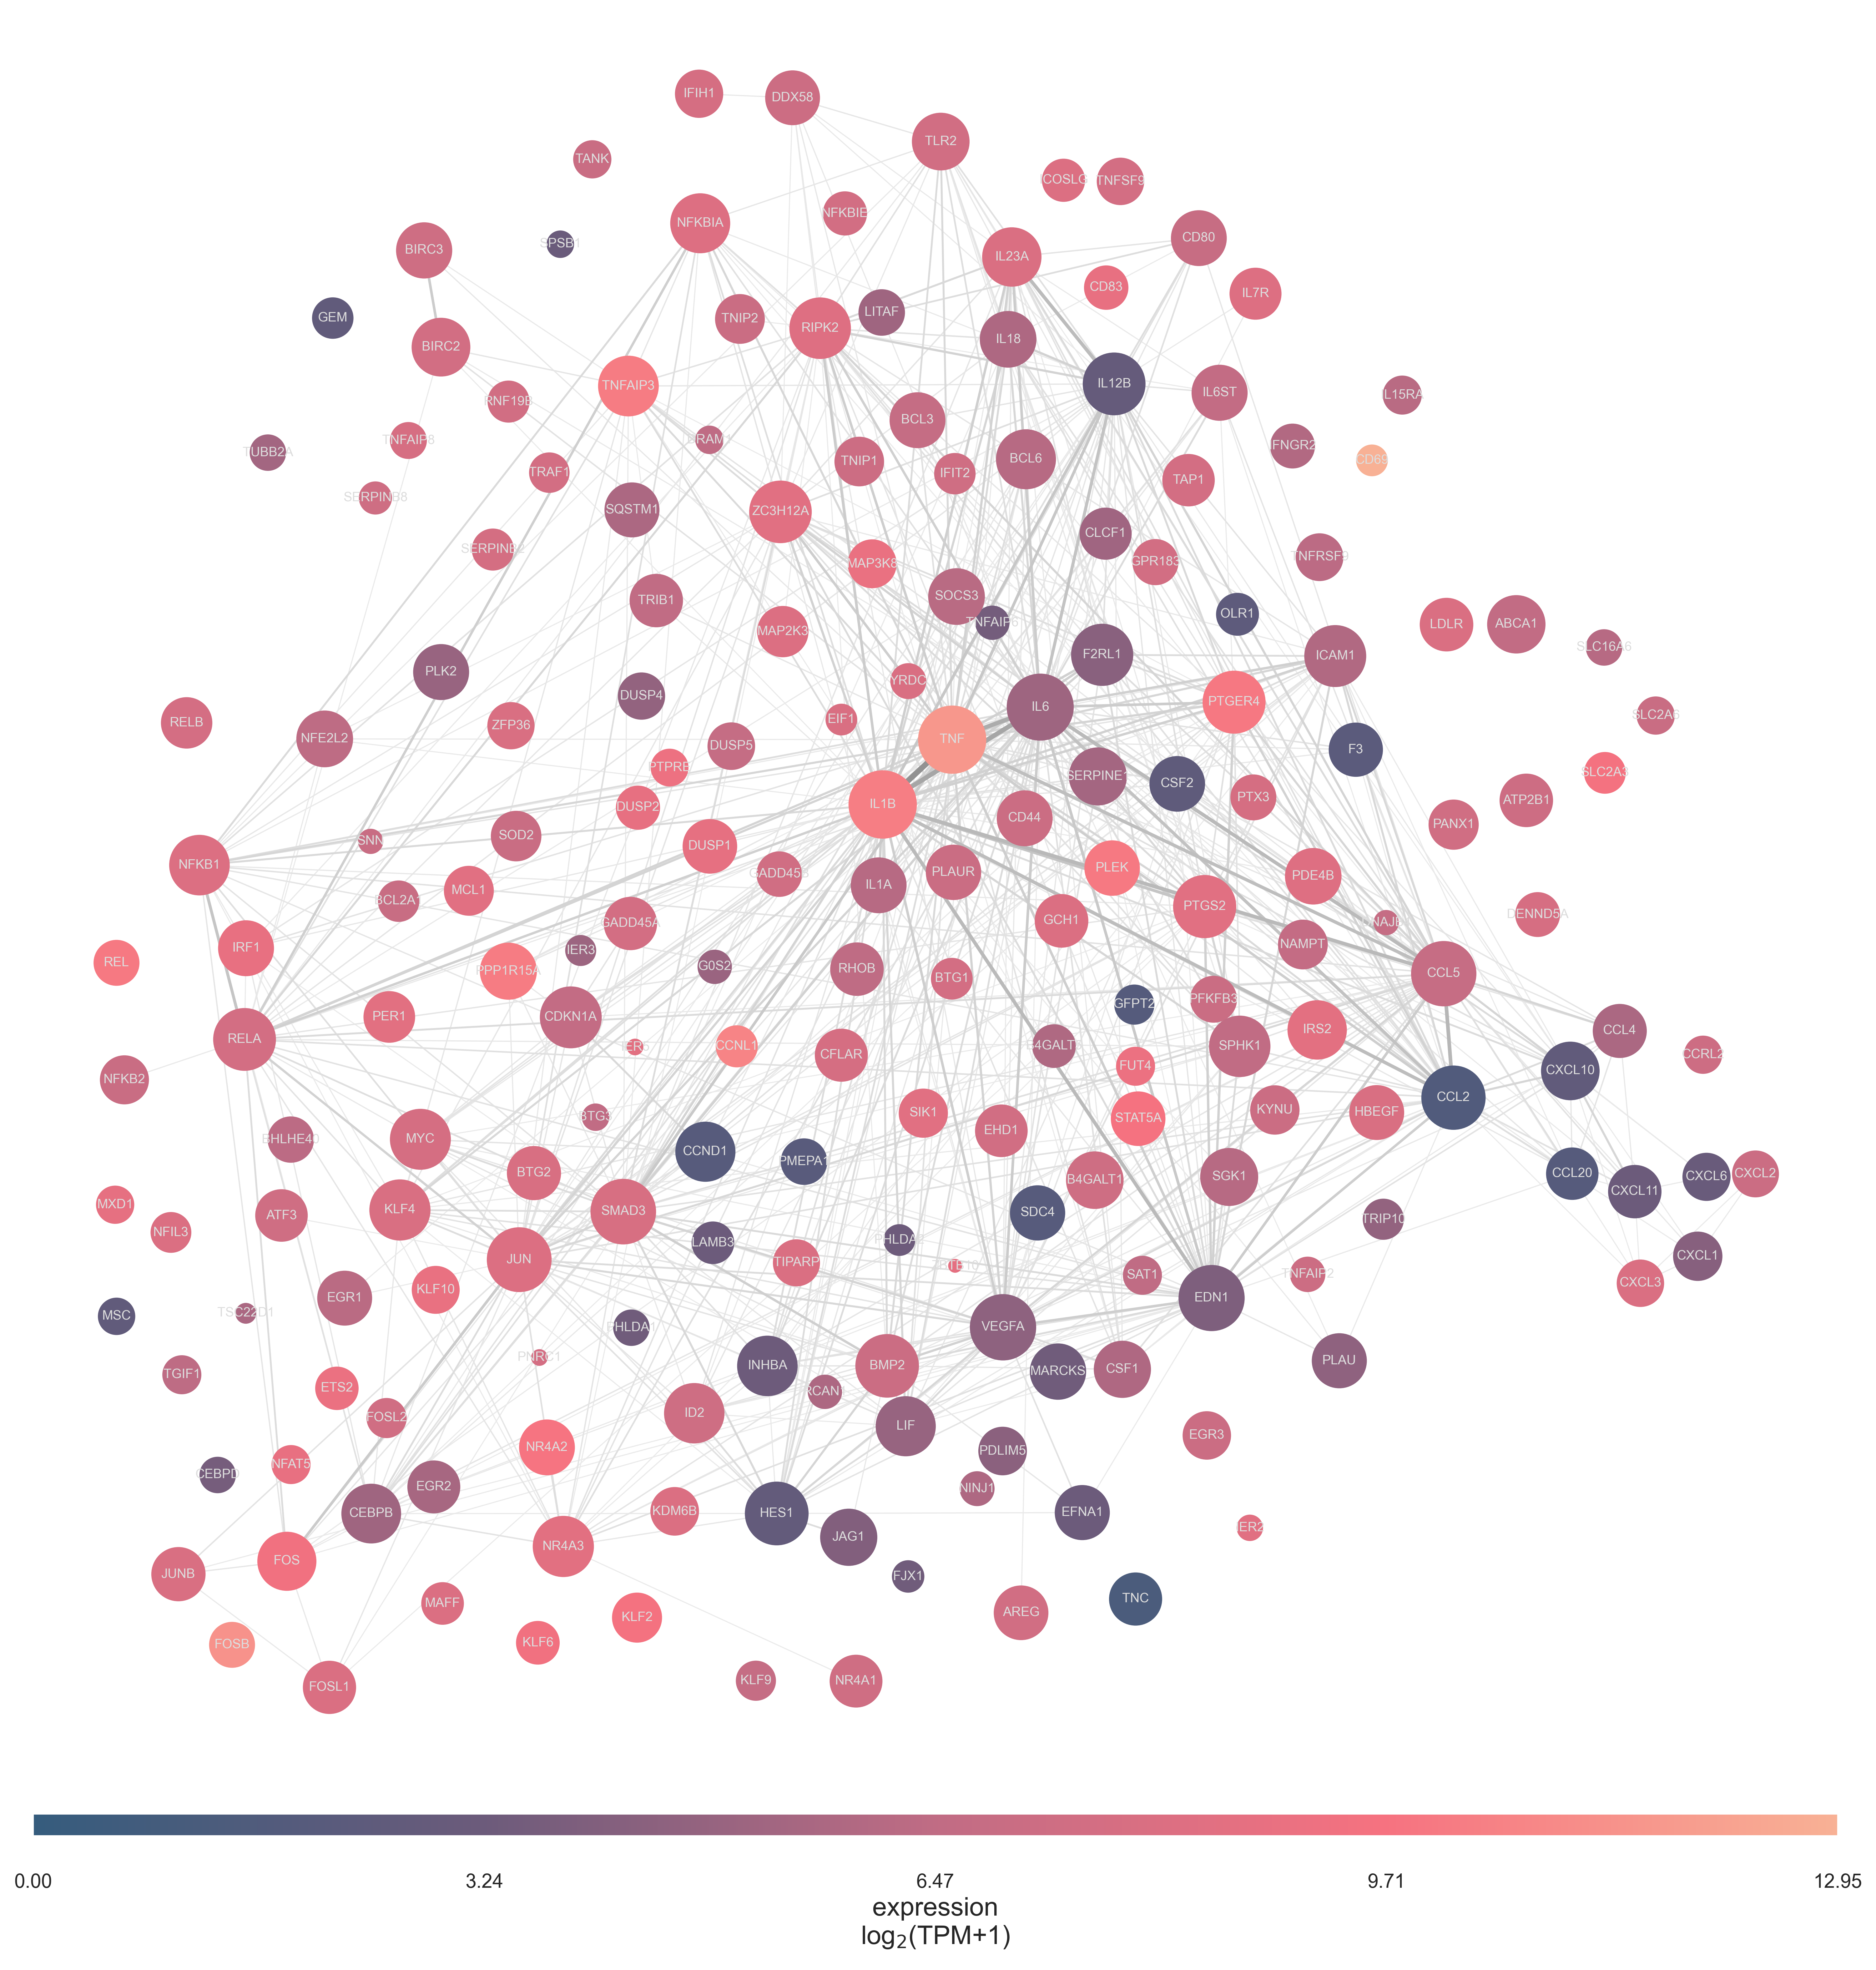
Gene sets network plots
A plotting function is available to plot a single gene set
as a network. Circles (genes) are connected by the relative
number of common appearances in other gene sets (a subselection subsel
within the provided ref file and). If provided, these can be colour coded by expression
(with exp). A cutoff can filter connections below
a certain percentage relative to the highest connection value observed.
from tapir.plotting import plot_genes_network

plot_genes_network(gset, subsel, exp=None, cutoff=.1, save_file='./net.png')